Price insights
Household Products That Got Cheaper Over Time
While overall consumer prices rose +48% from 2010 to 2025, 8 household product categories actually cost less, and 11 more rose by less than inflation, making them cheaper in real terms. Here they are, with examples from our catalogue.
Cheaper in dollars than in 2010
1. Televisions −88%
Flat-screen and smart TVs. Prices fell 88% between 2010 and 2025; over the last ten years the change was −71%. Browse: Electronics.

LG 55-Inch C9 OLED 4K Smart TV
Popular 2019–2020List price ≈$1,800
LG 75-Inch NanoCell 75 Series 4K Smart TV
Popular 2020–2023List price ≈$1,100
Roku 65-Inch Select Series 4K HDR Roku Smart TV
Popular 2023–2025List price ≈$449.99
LG 43-Inch UM6900 4K UHD Smart TV
Popular 2019–2020List price ≈$329.99
2. Telephone hardware, calculators and other consumer information items −78%
Smartphones and phone accessories. Prices fell 78% between 2010 and 2025; over the last ten years the change was −69%. Browse: Mobile & Computer Accessories.

Pela Eco-Friendly Compostable Case for iPhone 15, Black
Popular 2023–2025List price ≈$49.95
Amazon Basics Lightning to USB Cable 6 ft
Popular 2015–2025List price ≈$9.99
Speck Presidio Pro Case for iPhone 7/8/SE, Marine Blue
Popular 2016–2022List price ≈$44.95
Amazon Basics TV Wall Mount 32-80 Inch
Popular 2015–2025List price ≈$29.99
3. Computers, peripherals and smart home assistants −54%
Laptops, tablets, monitors, smart speakers. Prices fell 54% between 2010 and 2025; over the last ten years the change was −27%. Browse: Mobile & Computer Accessories, Smart Home.

Google Home Max, Chalk
Popular 2016–2020$353.99List price$399.0011% off
Google Nest Hub, Sand
Popular 2016–2020$75.99List price$89.9915% off
Amazon Echo Dot Smart Speaker with Alexa, 3rd Generation, Twilight Blue
Popular 2016–2020$43.99List price$49.9912% off
SanDisk Extreme Portable SSD 500GB
Popular 2015–2025List price ≈$79.99
4. Toys −53%
Toys, games and building sets. Prices fell 53% between 2010 and 2025; over the last ten years the change was −38%. Browse: Toys/Games.
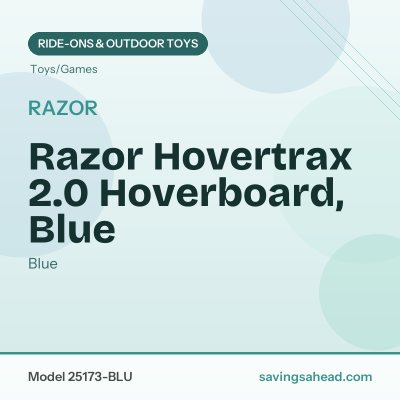
Razor Hovertrax 2.0 Hoverboard, Blue
Popular 2010–2020$329.99List price$399.9917% off
LEGO Star Wars Advent Calendar 75279
Popular 2011–2020$32.99List price$39.9917% off
Squishmallows Original Plush 16 in., Jack the Black Cat
Popular 2020–2025List price ≈$24.99
Snap Circuits Jr. SC-100
Popular 2010–2020$32.99List price$34.955% off
5. Audio equipment −44%
Speakers, headphones, soundbars. Prices fell 44% between 2010 and 2025; over the last ten years the change was −26%. Browse: Electronics.

Beats Flex, Transparent
Popular 2020–2025List price ≈$69.99
JBL Flip 7 Portable Bluetooth Speaker, Red
Popular 2020–2025List price ≈$149.95
TOZO A1 Mini Earbuds, Pink
Popular 2019–2025List price ≈$19.99
Samsung HW-Q800C Soundbar
Popular 2020–2025List price ≈$999.99
6. Other household equipment and furnishings −22%
Cookware, dishes, lamps, clocks, decor. Prices fell 22% between 2010 and 2025; over the last ten years the change was −6%. Browse: Household & Appliances.

YAMAZAKI home Tower Laundry Hamper, White
Popular 2015–2025List price ≈$69.00
Our Place Always Pan 2.0, Blue Salt
Popular 2020–2025List price ≈$150.00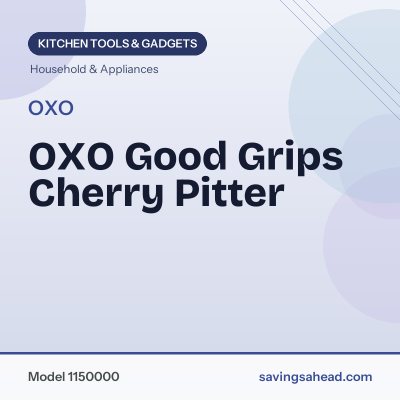
OXO Good Grips Cherry Pitter
Popular 2015–2025List price ≈$14.99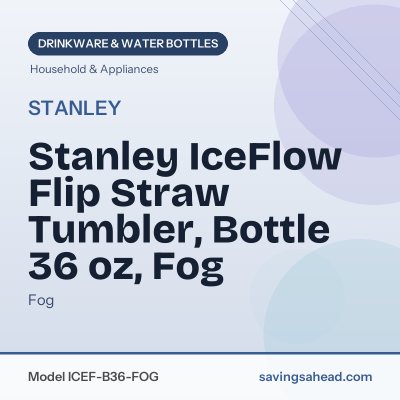
Stanley IceFlow Flip Straw Tumbler, Bottle 36 oz, Fog
Popular 2022–2025List price ≈$40.00
7. Window and floor coverings and other linens −14%
Sheets, towels, rugs, curtains. Prices fell 14% between 2010 and 2025; over the last ten years the change was +0%. Browse: Household & Appliances.

Zinus Joseph Metal Platform Bed Queen
Popular 2015–2025List price ≈$149.00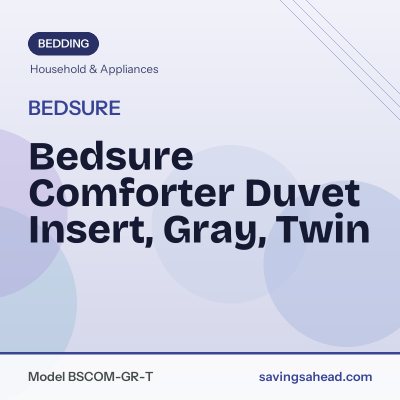
Bedsure Comforter Duvet Insert, Gray, Twin
Popular 2015–2025List price ≈$35.99
Hotel Collection Supima Cotton 525 Thread Count Sheet Set, White, Queen
Popular 2015–2025List price ≈$169.99
Purple SoftStretch Sheets Queen
Popular 2020–2025List price ≈$179.00
8. Major appliances −9%
Refrigerators, washers, dryers, ranges. Prices fell 9% between 2010 and 2025; over the last ten years the change was +1%. Browse: Household & Appliances.
LG 24 cu ft Bottom-Freezer LRDCS2603S, Stainless Steel
Popular 2015–2025List price ≈$1,799
LG Front Control LDFN4542S, Stainless Steel
Popular 2015–2025List price ≈$549.00
Samsung 27 cu ft Side-by-Side RS27T5200SR, White
Popular 2015–2025List price ≈$1,399
LG InstaView Door-in-Door 26 cu ft LRMVS2806S, White
Popular 2015–2025List price ≈$3,199
Cheaper after inflation
These categories cost more than in 2010, but their prices rose by less than overall inflation (+48%), so they take a smaller share of a household budget than they used to.
| Category | 2010 to 2025 | After inflation | Browse |
|---|---|---|---|
| Other appliances vacuums, coffee makers, blenders, microwaves | +0.2% | −32.1% | Household & Appliances, Coffee Makers |
| Sporting goods sports and fitness equipment | +2.3% | −30.7% | Outdoors/ Sports/ Garden, Sports Wear & Gear, Sports Giftware & Collectibles |
| Household furnishings and supplies the overall household goods basket | +8.9% | −26.3% | Household & Appliances |
| Apparel clothing and accessories | +9.9% | −25.6% | Apparel & Accessories |
| Furniture and bedding sofas, tables, mattresses | +10.8% | −25.0% | Household & Appliances |
| Personal care products hair, skin and dental care, cosmetics | +11.8% | −24.3% | Health, Beauty & Personal Care, Makeup & Skin Care |
| Tools, hardware, outdoor equipment and supplies power tools, hardware, lawn and garden | +23.2% | −16.5% | Tools, Outdoors/ Sports/ Garden, Faucet |
| Pets and pet products pet food and supplies | +24.7% | −15.5% | Pet Supplies |
| Housekeeping supplies cleaning products, paper goods, storage | +29.6% | −12.2% | Household & Appliances |
| Jewelry and watches watches and jewelry | +33.4% | −9.6% | Jewelry |
| Food at home groceries, including snacks and nutrition products | +45.1% | −1.7% | Food, Sports Nutrition & Protein, Diet & Nutrition |
Source: U.S. Bureau of Labor Statistics, CPI-U, U.S. city average; annual averages, data through September 2026. Category price changes include the statisticians' adjustment for quality improvements. Example products are from the Savings Ahead catalogue.